November Market Update Summary
• Winter Weather Outlook
• All Eyes on OPEC
• Historical Distillate Demand
• United States Dollar vs. Commodity Prices
La Nina and Winter Weather
Move over, Frosty – winter weather has been unusually warm the last few years, and the question on many people’s minds is whether this year is going to be a continuation of that trend. These temperature changes we’ve seen can be attributed to a few different factors, but a major contributor to erratic winter weather is the phenomenon of El Nino – Southern Oscillation.
As part of this phenomenon, Pacific Ocean current patterns can be in one of three states: normal, El Nino, or La Nina. In a normal phase, warm water is pushed away from North and South America and into Southeast Asia. In El Nino conditions, this flow reverses, with warm water pooling along the coasts of North and South America, and cold water pushing further into the Pacific Ocean. A La Nina phase is reminiscent of the normal phase, albeit with a substantially stronger pool of warm water along the coasts and an increased outflow of cold water.
After understanding what causes each of these phases, we can finally ask ourselves this question: How is this going to affect winter weather? This year we are in the La Nina phase, so the cold water moving up the Pacific Coast is going to drive the polar jet stream further north, leading to cooler, wetter winters within the Northeast, and warmer, drier winter conditions within the Midwest and Southeast.
The El Nino – Southern Oscillation is just one of many weather events affecting fuel demand each year. Weather is a variable that is out of our control; however, understanding and anticipating weather changes can give you greater agency in managing your fuel needs −no matter the time of year.
OPEC+ Outlook Overview
• OPEC+ projects global economic growth to continue at 3% through the end of 2024 and into 2025.
• World oil demand is still expected to grow this year, but this has been reduced by 106 mb/d from their prior estimate, signifying underlying demand weakness.
• The United States leads the charge in the makeup of this world oil demand growth, with most US demand growth coming from strong demand for diesel fuel.
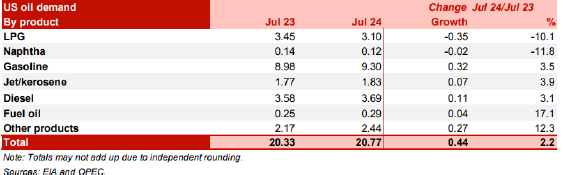
• China’s demand growth is lower than anticipated, with slower diesel fuel demand amidst turmoil in the domestic construction industry.
• Oil demand from both India and Europe declined from 2023 into 2024.
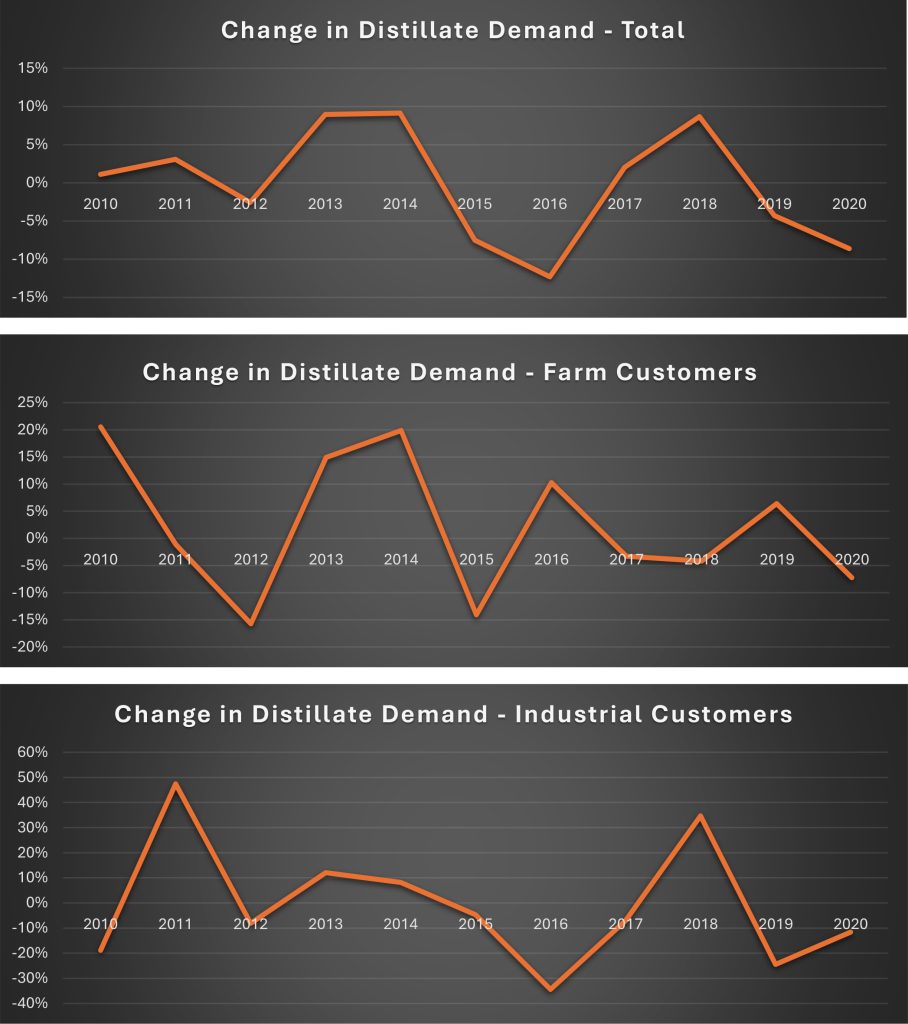
Understanding Historical Distillate Consumption in PA
When thinking strategically about your fuel, it is easy to get lost in the day-to-day of the market. Feedback from customers and instantaneous market news can make you feel like you can’t get a pulse on where the market will go, but analyzing historical trends can provide you comfort and knowledge in making smart decisions about your fuel needs and those of your customers. Overall, diesel fuel demand in the state of Pennsylvania has grown on average, roughly 0.26% a year since 1984. During that same time, sales to residential consumers have declined .67%, and sales to commercial consumers have declined 1.24%. Sales to industrial consumers have increased 0.86%, and sales to farm consumers have increased 2.90%. Sales to On-Highway customers have increased from 1984-2020 as well, by 1.89%.
Overall, the numbers point to growth, and if the past is any indication, then we should see further growth and demand in the future. This should give you peace of mind and knowledge to help you service your customers effectively as we move towards the future.
Organization of Petroleum Exporting Countries. (2024) OPEC Monthly Oil Market Report.
Energy Information Agency (2020). Sales of Distillate Fuel Oil by End Use. Energy Information Agency. U.S. Sales of Distillate Fuel Oil by End Use
United States Dollar vs. Commodity Prices
As the United States transitions to a new administration in the White House, the market does its best to anticipate potential short-term and longer-term impacts of policy change. For example, the Trump Presidency should lead to a shift from renewable fuels to domestic hydrocarbon production. However, the economic policies related to trade and inflation will also have an impact on the petroleum market in the United States. The expectation that new tariffs on goods from China and the rest of the world will lead to increased inflation as a result. Ultimately, an excepted rise will lead to a more hawkish monetary policy of higher interest rates and a stronger US Dollar. But how does this impact commodity prices?
Domestic commodities (Metals, Energy, Agriculture) are priced in US Dollars; therefore, there is a direct relationship between trends in the US Dollar and commodity prices, more specifically, an inverse relationship. For example, if the US Dollar weakens because of lower interest rates (which occurred again in early November where the Federal Open Market Committee decided to reduce interest rates by an additional 25 basis points), then it will take loss of a foreign currency to purchase US commodities and thus foreign demand will increase leading to an appreciation of prices. The converse is also true, a stronger US Dollar decreases demand from foreign investment thus weakening US commodity prices.
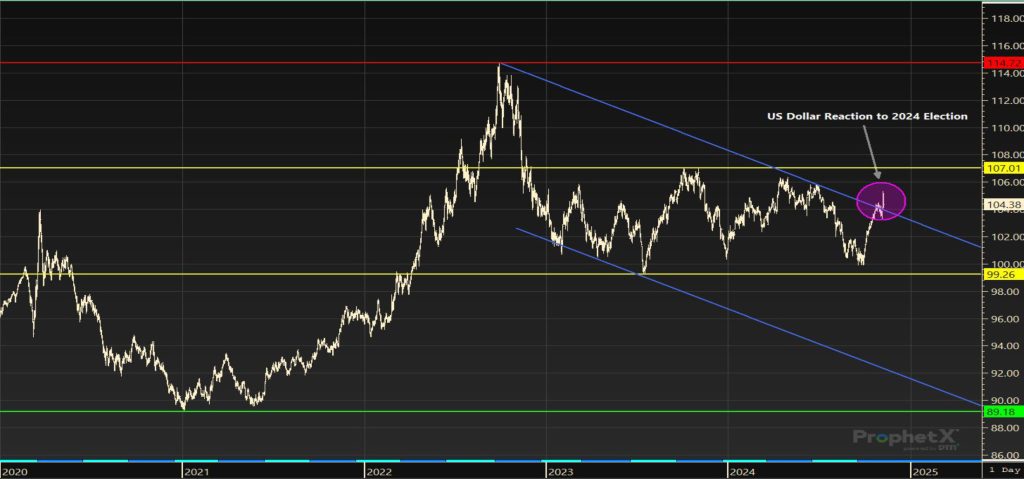
The initial reaction to the re-election of Donald J. Trump was a 1.6% increase in the US Dollar Index Prices which for the moment have broken out of a downward trend that began two years ago (see chart below). However, President Trump’s first term saw a relative flat trend of the US Dollar Index, although volatile.
After two straight FOMC meetings resulting in interest rates cuts totaling 50 basis points and rhetoric that inflation is progressing towards target level, the market expects interest rate cuts to continue into 2025, which will lead to a weaker dollar and stronger commodity prices (all else equal). It is worth watching whether future policy will change this narrative.
US DOLLAR INDEX – 2020 Through 2024 Strength Index