December Market Update Summary
• Regional Supply Dynamics
• OPEC Production Decision
• Degree Days
• Refinery Operations
Market Indicators
The U.S. domestic diesel market saw a continued decline in retail prices, averaging $3.59 per gallon, while inventories slightly increased to 219.7 million barrels. Diesel demand remained relatively weak at around 3.74 million barrels per day, with the agricultural sector showing a slight uptick due to seasonal harvesting activities, but overall consumption was still below expectations.
In contrast, the gasoline market experienced a slight decrease in average retail price to $3.08 per gallon, with inventories decreasing to 214.6 million barrels. Gasoline demand remained robust across much of the retail sector, reflecting higher consumer mobility and travel during the holiday season. Lower gasoline prices provided relief to consumers at the pump, but the strong demand highlighted a relatively stable economic outlook.
According to the U.S. Energy Information Administration’s (EIA) Short-Term Energy Outlook for November 2024, retail gasoline prices are projected to average $3.30 per gallon in 2024, down from $3.50 per gallon in 2023. This decrease is attributed to an increase in U.S. crude oil production and a rise in refinery runs, which have helped to boost gasoline inventories. On the other hand, diesel prices are expected to remain relatively stable, averaging around $3.20 per gallon in 2024, compared to $3.30 per gallon in 2023. The stability in diesel prices is due to steady demand and balanced supply, despite fluctuations in crude oil prices.
Overall, the outlook suggests a slight easing in gasoline prices and stable diesel prices for the upcoming year. Diesel prices are forecasted to drop to around $3.46 per gallon in the first quarter of 2025, but then rise to about $3.75 per gallon by the end of the year due to refinery closures and increased demand. Gasoline prices are also expected to decrease slightly, averaging around $3.20 per gallon for the year.
(Source: EIA, World Energy News, Platts)
OPEC Production Decision
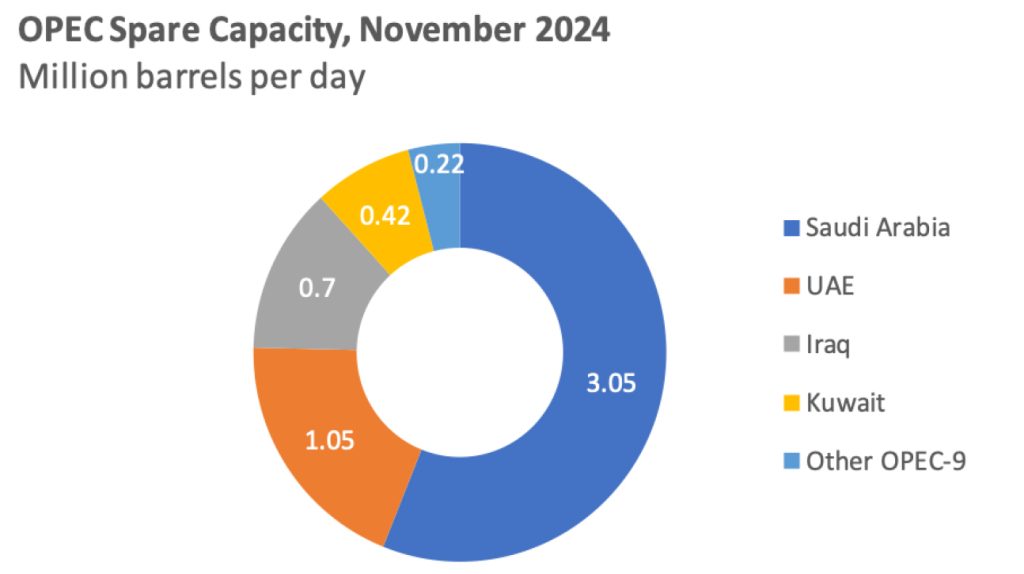
OPEC’s latest decision to delay production increases until April 2025 and extend the full unwinding of cuts until the end of 2026 reflects the ongoing challenges OPEC faces in balancing the market. Market analysts anticipate that OPEC will continue to extend production cuts, if necessary, in 2025, but there is also a risk of internal disagreements among members if oil prices remain low.
The most recent meeting was the 38th of the Joint Ministerial Monitoring Committee, where the decision to reduce production was implemented during the 35th meeting – reflecting an effort to balance global supply and demand dynamic. Their decision was influenced by several factors. First, weaker than expected global oil demand, particularly from China, has led to a surplus in the market. Second, increased production from non-OPEC countries, such as the United States and Brazil, has further pressured OPEC to keep production low to avoid exacerbating the oversupply. Third, lower oil prices have strained the fiscal budgets of OPEC member countries, making it crucial to support prices by limiting output. Lastly, geopolitical tensions in the Middle East have added uncertainty to the market, prompting OPEC to adopt a cautious approach.
Over time, OPEC’s strategy has evolved significantly. In 2022, OPEC began withholding output to counteract a supply glut and shore up prices. However, as non-OPEC production surged and demand forecasts were repeatedly downgraded, OPEC extended and deepened its production cuts.
Despite OPEC’s efforts, the global oil market is anticipated to return to surplus in 2025. This surplus is expected to put downward pressure on oil prices, with projections indicating that prices could average around $71 per barrel over the year. However, the International Energy Agency (IEA) forecasts a global oil surplus of 950,000 bpd even if OPEC maintains its current production levels
(Source: Reuters, Markets Insider, Platts, OilPrice.com, Arab Gulf States Institute)
Understanding Degree Day Indicator
As many of you are already aware, the market uses degree days to project demand by measuring the deviation of outdoor temperatures from a standard baseline, typically 65°F. Heating degree days (HDDs) and cooling degree days (CDDs) are calculated to estimate the energy needed for heating and cooling. Historical data is used to show trends in HDDs and CDDs over time, which is then applied to include weather patterns, economic activity, population growth, and technological advancements in energy efficiency. Historical charts and degree day data are used by the industry to correlate energy demand with prices.
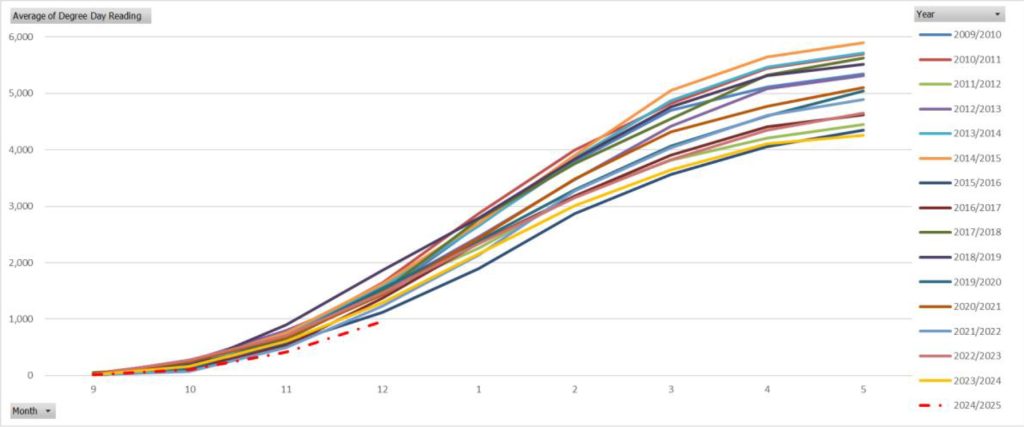
Degree days help create a baseline for normal energy consumption. This baseline allows for comparison against current and projected degree days to identify anomalies or patterns in energy demand. Degree days are used for both short-term and long-term forecasts. Short-term forecasts help utilities manage daily operations, while long-term forecasts aid in strategic planning, such as infrastructure investments and resource allocation.
(Source: EIA, Platts, NWS, Weather Underground)
Refinery Operations
The Ohio and Pennsylvania diesel markets were impacted by the continued variability of Midwest refinery operations. The market digested the delayed restart of BP Whiting (440,000 bpd) refinery in
Indiana, which impacted fuel prices due to maintenance issues with the crude distillation unit and coker. This was combined with the interruption to refinery operations at Exxon Joliet (275,000 bpd) refinery and Cenovus Lima (183,000 bpd) and Toledo (160,000 bpd) refineries in Ohio, which led to a decrease in regional refinery utilization and drew down inventories. The resulting impact was continued price volatility, which saw a slight increase due to ongoing refinery maintenance and crude oil price volatility.
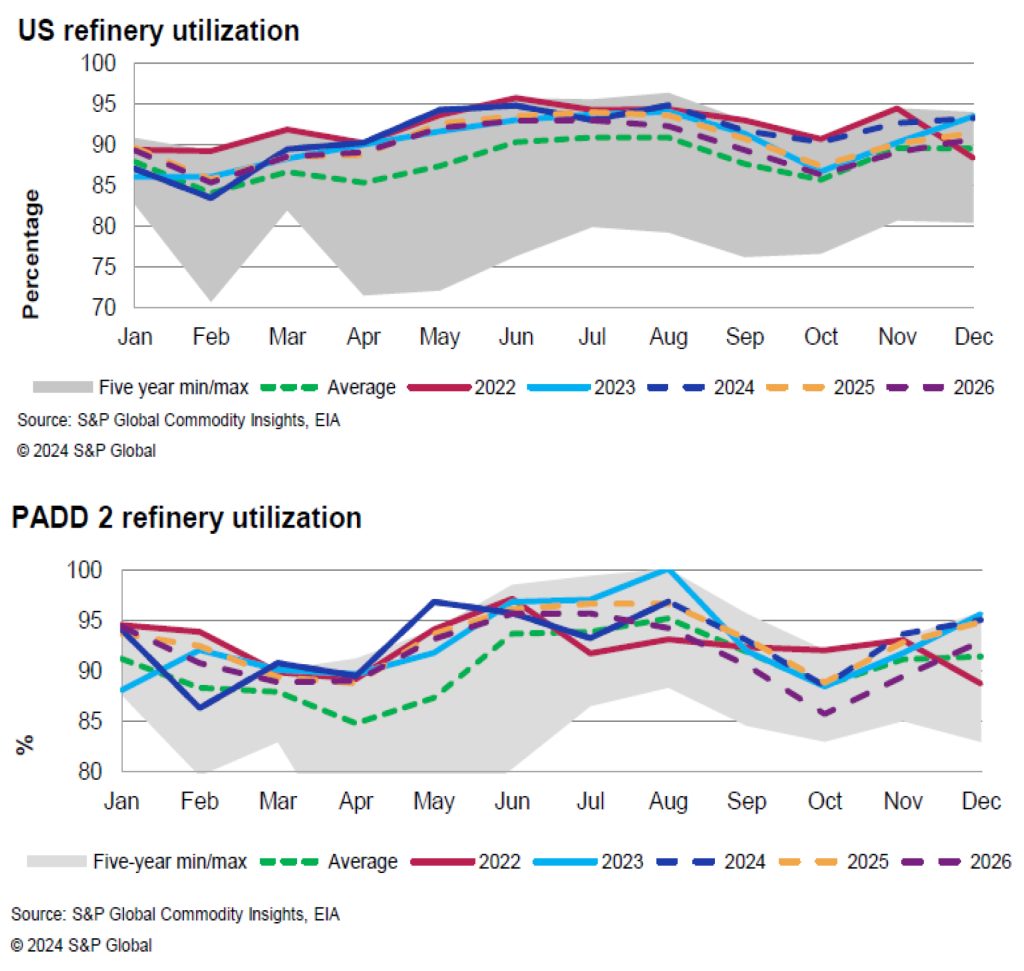
Refining margins, also known as crack spreads, represent the difference between the cost of crude oil and the price of refined products like gasoline and diesel. Midwest refining margins saw some improvement, which was supported by the decrease in product availability, created by the previously stated refinery operating issues. Seasonal maintenance and economic run cuts also provided support. However, crack margins have been declining, reflecting increased product availability and declining demand.
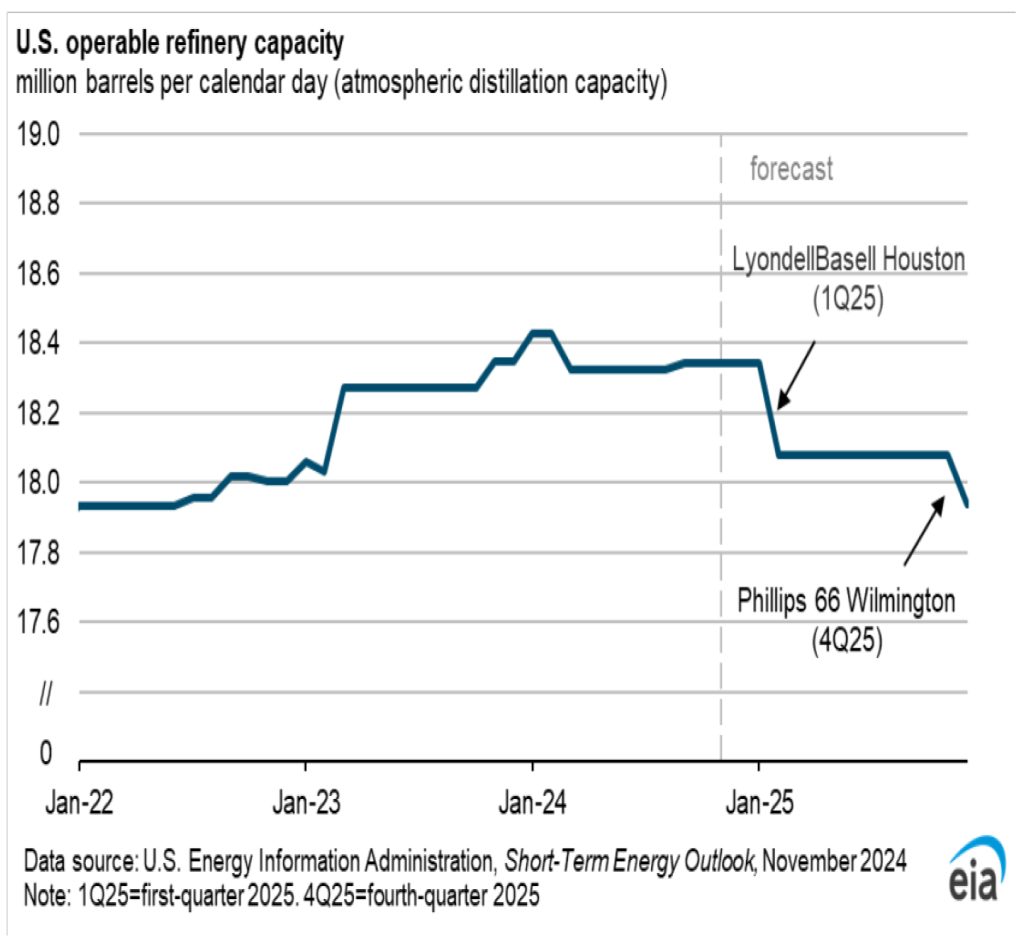
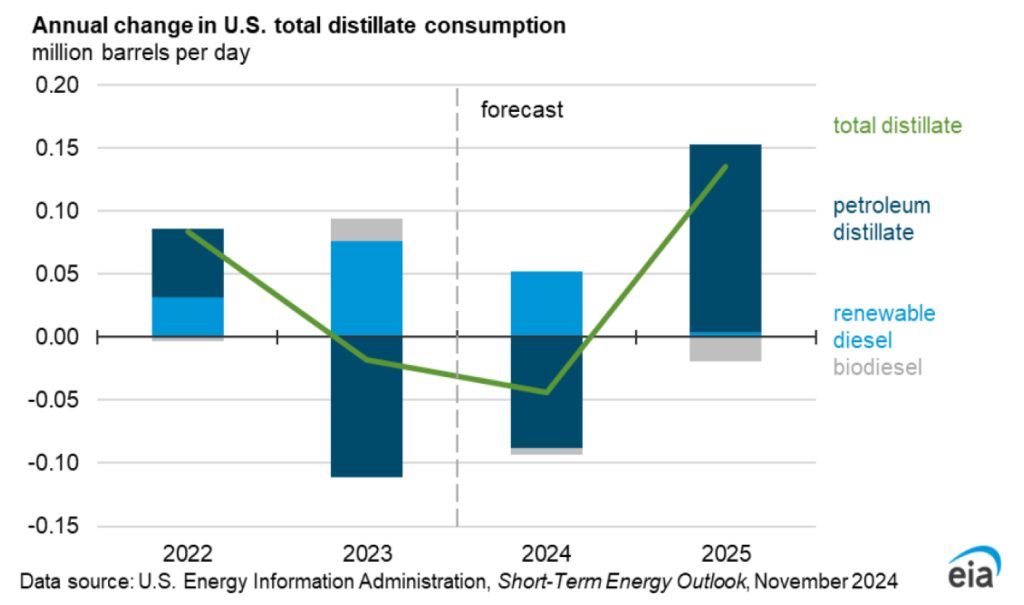
Global refinery runs hit a seasonal low in October before starting to recover in November. The U.S. Energy Information Administration (EIA) reported that refinery crude oil inputs and utilization rates fluctuated due to seasonal maintenance and unexpected outages. Despite these challenges, refinery runs are expected to average 82.8 million barrels per day (mb/d) in 2024 and 83.4 mb/d in 2025. Implied diesel demand remained relatively stable, supported by growth in domestic manufacturing activity and increased demand from truck transportation. The EIA forecasts that U.S. consumption of distillate fuels will grow by about 4% in 2025.
(Source: EIA, Platts, Reuters)