
April Market Update Summary
• Current Market
• Tariffs and Volatility
• Implications
• Indicators
Current Market Review
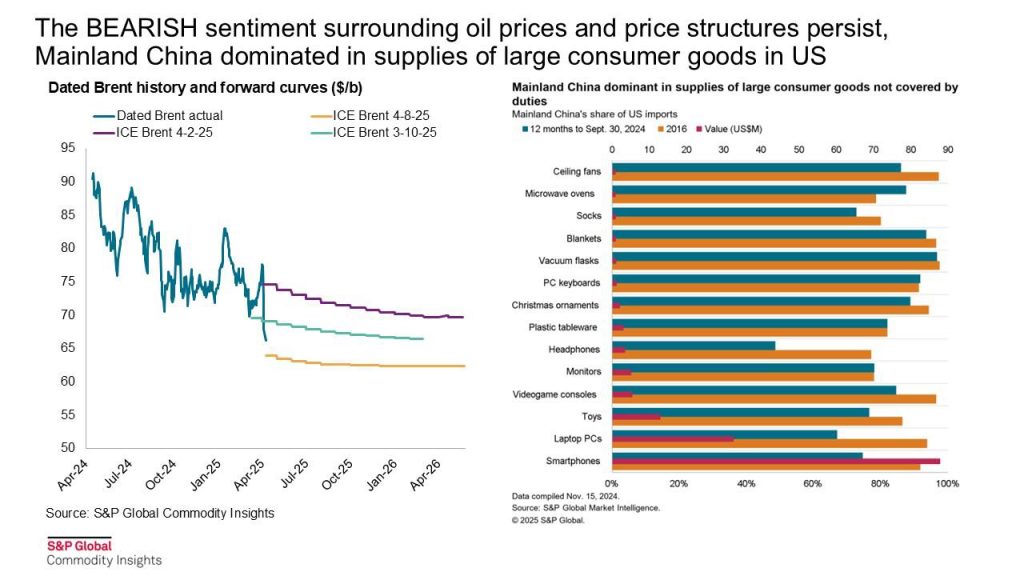
Crude oil prices are a big factor here. Recent tariffs and retaliatory measures by the US and China are expected to slow global economic growth and reduce oil demand growth. This could lead to lower crude oil prices, which in turn should narrow cracks and spreads. If demand drops, refined product supply-demand balances will soften, weakening cracks and margins.
Refinery maintenance remains a key factor. Global refinery outages are expected to peak by mid-April and then decline through May and June. Refining margins remain healthy, supporting continued crude runs with no sign of economically driven cuts. This stability helps maintain a steady supply of refined products, influencing gasoline and diesel prices. Monitoring stock levels in key Petroleum Administration for Defense Districts (PADDs) is crucial for understanding regional supply-demand dynamics. Gasoline and diesel stock levels are drawing in line with seasonal norms, with some regional variations. These stock levels and arbitrage opportunities can significantly impact prices.
Keeping an eye on import and export volumes, particularly from Europe and Latin America, is essential as shifts in these flows will affect regional balances and prices. Changes in vehicle miles traveled and work-from-home rates will influence gasoline demand trends. Tracking gasoline and diesel cracks, as well as retail prices, will help gauge market tightness and potential price shocks. Monitoring inventory levels across PADDs, especially in PADD 1 and PADD 5, will help anticipate supply constraints and regional imbalances.
Tariffs and Volatility
A quick rundown of the recent executive order issued by the President on April 9, 2025. This order modifies reciprocal tariff rates in response to China’s retaliatory measures. Essentially, it builds on a previous executive order (14257) that imposed additional duties to tackle the ongoing U.S. trade deficits.
China retaliated by announcing an 84% tariff on U.S. goods, which prompted the President to further adjust the Harmonized Tariff Schedule of the United States (HTSUS). The new modifications increase duties on Chinese imports to counteract the economic threat posed by China’s actions. The goal here is to protect U.S. national and economic security by addressing the trade imbalances and industrial policies that contribute to these deficits.
Additionally, tariffs ranging from 10% to 49% on renewable energy components such as solar panels and wind turbines are expected to increase costs and potentially slow down the growth of clean energy projects. Trump also announced a 90-day pause on all “reciprocal” tariffs, temporarily reducing tariff rates for countries other than China. However, tariffs on Chinese goods will be increased to 125%, affecting the import of energy-related products from China. The announcement led to a significant rally in US markets, with the S&P 500 posting its best day since October 2008. These changes are part of Trump’s broader trade strategy, aiming to boost domestic production while navigating complex international trade dynamics.
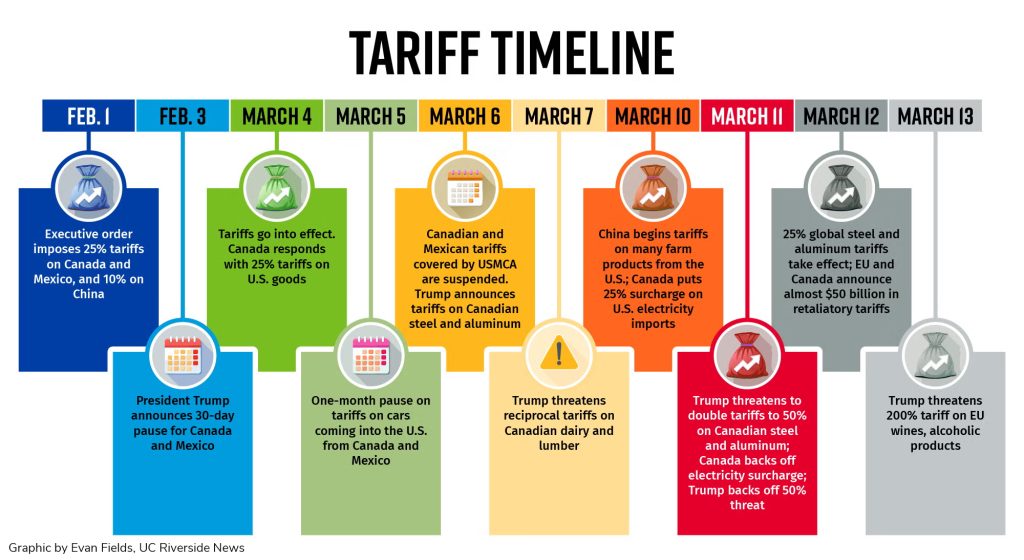
In response to the U.S. tariffs, China has imposed its own tariffs on U.S. energy exports, including a 15% tariff on coal and LNG and a 10% tariff on crude oil. These retaliatory measures further intensify the trade war and could impact U.S. energy exports to China. Additionally, the tariffs are expected to disrupt the global supply chain for clean energy components. Experts highlight that many materials and components needed for renewable energy projects are not produced domestically at the necessary scale. This disruption could hinder the U.S.’s ability to achieve its climate goals in the short term.
Potential Implications
Foremost, a discussion regarding economic uncertainty and consumer spending. Recently, the US Consumer Confidence Index dropped to a two-year low of 57 in March 2025. This decline shows that people are worried about economic stability, tariffs, and inflation. When consumer confidence is low, people tend to spend less, which can reduce demand for things like fuel. Despite some moderation, inflation is still a concern. In the US, inflation rates decreased slightly to 2.8% in February, but it still affects how much we can buy with our money, including fuel.
Oil prices are influenced by global demand, refinery runs, and OPEC+ actions. Weakening global demand, particularly from China, has led to lower oil prices. However, geopolitical tensions and supply disruptions can cause price volatility. For instance, global refined product demand growth is forecasted to grow by 0.88 Mbd y/y in 2025, down from 1.40 Mbd in 2024. Lower refinery runs due to closures will reduce crude oil intake, impacting oil prices. The US Energy Information Administration expects crude imports to fall to the lowest level since 1971, reducing the price of Brent crude. OPEC+’s decisions to remove or restore oil supply can significantly impact oil prices. For example, OPEC+ actions to cut production can lead to higher oil prices.
Gasoline prices are expected to rise due to supply constraints. The delayed ramp-up of the Dangote refinery and planned maintenance will limit gasoline supply to the US East Coast, leading to tighter markets and higher prices. For example, gasoline stocks in PADD 1 are expected to be tighter in 2025 due to refinery downtime and redirected European gasoline. Increased driving during the summer months will further tighten gasoline markets, pushing prices higher. For instance, US vehicle miles traveled reached new highs in 2024, but gasoline demand continues to lag pre-pandemic levels due to efficiency improvements and elevated work-from-home rates. California gasoline cracks will remain elevated due to regional supply constraints, leading to higher prices compared to other regions. For example, gasoline stocks remain low on the West Coast due to downtime at PBF Martinez.
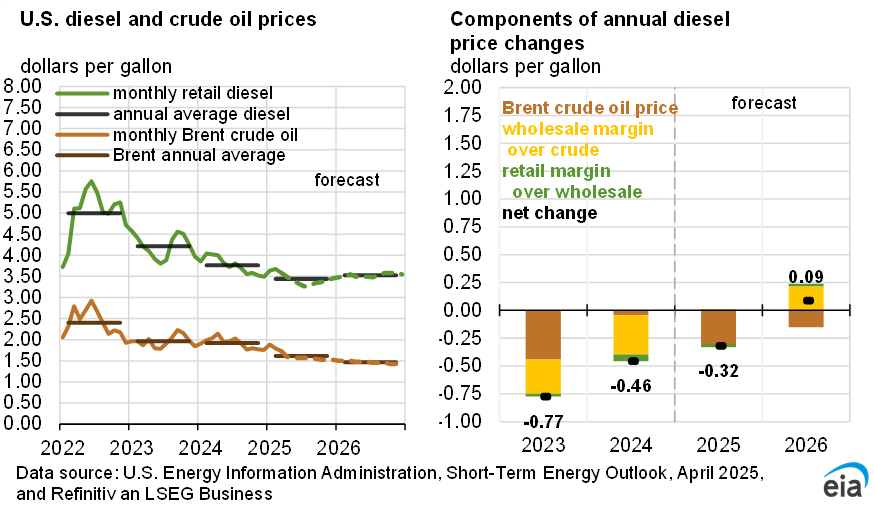
Diesel prices are likely to remain elevated due to strong demand for heating oil during colder months. For example, diesel stocks in PADD 1 have remained at or below five-year minimums due to cold weather and local turnarounds. Unplanned refinery outages and lower renewable diesel production will constrain supply, leading to higher diesel prices. As was the case for the closure of Phillips 66 Los Angeles refinery which reduces diesel production through 2026. Strong exports to Latin America and Europe will keep US diesel prices high. Notably, the US diesel exports increased to 1.33 million b/d in December, driven by strong flows to Brazil and Northwest Europe.
Indicators to Watch
Slower economic growth can also impact employment and industrial activity. When the economy grows more slowly, job creation can weaken, and unemployment rates might rise. This affects consumer income and spending capacity, which in turn influences demand for gasoline and diesel. For instance, the OECD projects US GDP growth to slow from 2.2% in 2025 to 1.6% in 2026. Additionally, reduced industrial production growth can lead to lower demand for diesel, which is heavily used in transportation and manufacturing.
Oil prices have been quite volatile due to economic uncertainty and trade tensions. Platts Dated Brent saw a significant decline from $78 to $67 between April 1 and April 7, reflecting these issues. The OECD projects global GDP growth to moderate from 3.2% in 2024 to 3.1% in 2025 and 3.0% in 2026. Under the base-case scenario, Platts Dated Brent is projected to average $72/b for the year, down from $81/b in 2024. This downward trend is expected to continue into 2026, with an average price of $69/b.
So, what should you keep an eye on? Monitoring changes in consumer confidence can provide insights into potential shifts in consumer spending and demand for fuel. The US Consumer Confidence Index dropped to a two-year low of 57 in March 2025. Trends in Platts Dated Brent and other oil price benchmarks are crucial for understanding future price movements. Persistent inflation can influence fuel prices and consumer spending power. The OECD projects headline inflation in G20 economies to fall from 3.8% in 2025 to 3.2% in 2026. Central bank policies, such as those by the US Federal Reserve and ECB, can impact economic activity and fuel demand. The US Federal Reserve decided to keep the federal funds rate unchanged during its monetary policy meeting in March 2025.
Sources;
1) Platts, Oil Price Information Service, Forbes
2) U.S. Energy Information Administration & U.S. Customers and Border Protection
3) JP Morgan Chase
4) WhiteHouse.gov