Even if you understand the basics of carbon offsets , it’s easy to get bogged down in the complexity, acronyms and jargon that conjure up images of Clark Griswold’s tangled ball of holiday lights (a timely nod to the cinematic masterpiece that is Christmas Vacation).

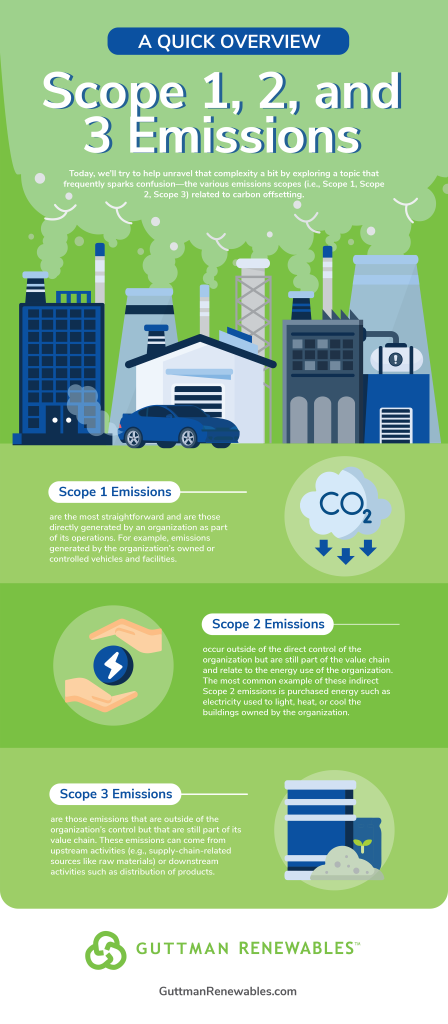
Today, we’ll try to help unravel that complexity a bit by exploring a topic that frequently sparks confusion—the various emissions scopes (i.e., Scope 1, Scope 2, Scope 3) related to carbon offsetting.
- Scope 1 emissions are the most straightforward and are those directly generated by an organization as part of its operations. For example, emissions generated by the organization’s owned or controlled vehicles and facilities.
- Scope 2 emissions occur outside of the direct control of the organization but are still part of the value chain and relate to the energy use of the organization. The most common example of these indirect Scope 2 emissions is purchased energy such as electricity used to light, heat or cool the buildings owned by the organization.
- Scope 3 emissions are those emissions that are outside of the organization’s control but that are still part of its value chain. These emissions can come from upstream activities (e.g., supply chain related sources like raw materials) or downstream activities such as distribution of products.

It’s important to note that while one organization’s emissions will not overlap across scopes (Scopes 1, 2 and 3 are all distinct buckets), the same emissions can be viewed as different scopes by different parties.
For example, a transportation company (Company A) delivers goods for manufacturer (Company B). Emissions from Company A’s fleet of vehicles are included in that company’s Scope 1 emissions as they are directly generated by the company as part of doing business. However, those same emissions will be considered Scope 3 emissions by customers like Company B, whose goods are delivered by Company A.
Still a little hazy on what’s included in the various scopes and how they interact? The diagram below from GHG Protocol provides a helpful visualization with examples for each scope. If you have questions about emissions or carbon offsets, we’d love to hear from you! Visit our Guttman Renewables site to learn more about how we can help and get in touch.

Image source: GHG Protocol

